Sample Results
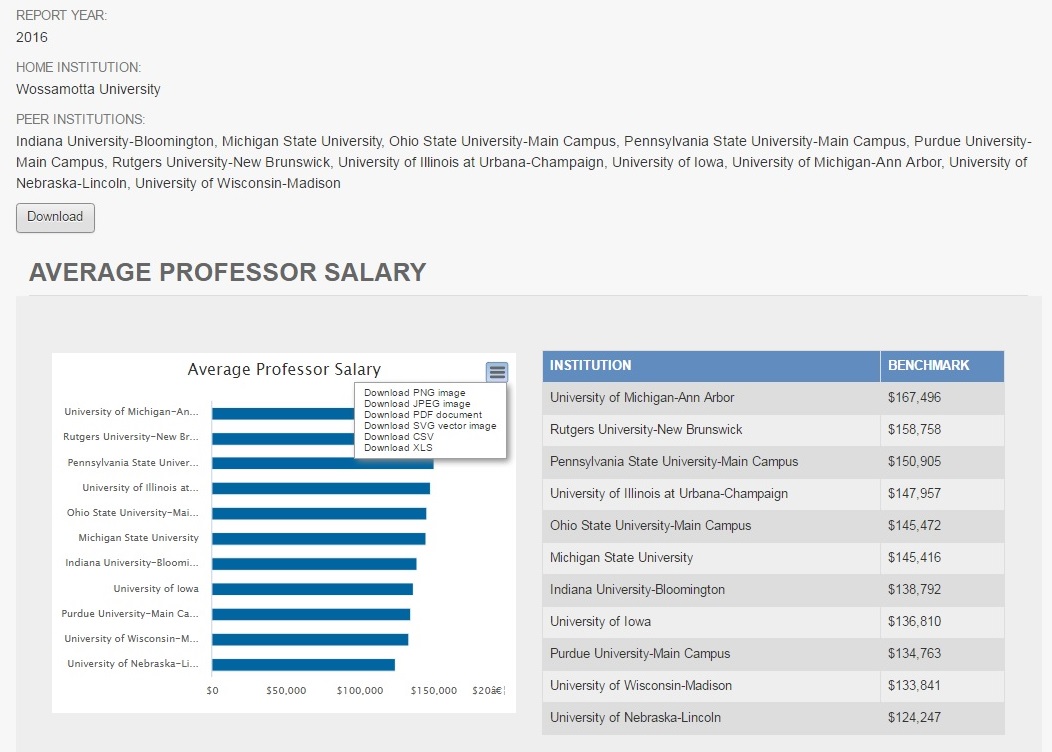
The results portal allows users to conduct analyses on many variables related to full-time faculty salaries, benefits, and continuing full-time faculty. Users may view national results or create peer groups to analyze and export one or more variables. Once a peer group has been selected, a user may review descriptive statistics in bar graphs or tables as evidenced below. Data may be downloaded into a column separated values (.CSV) or Excel (.XLS) formats. Bar graphs may be downloaded as image files (PNG, JPEG, SVG), portable document files (PDF), or database files (CSV, XLS).
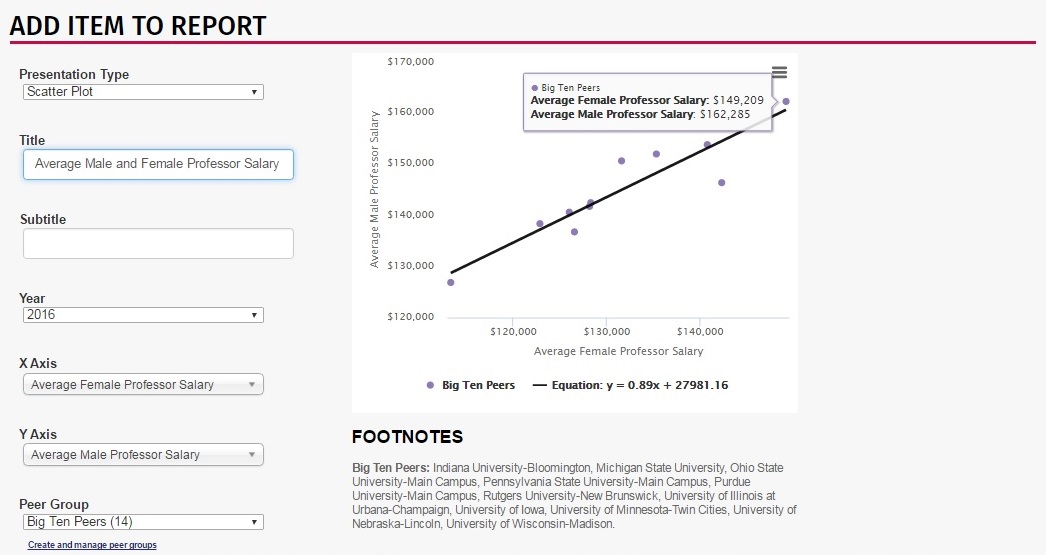
Multiple variables may be built and edited into a report which may be exported as well. Peer groups may be built into median percentile bar charts, scatter plots, and bubble plots. Univariate, bivariate, and regression statistics may be printed or exported into one comprehensive report. For each scatter plot or bubble plot, regression lines may be included as well as peer reports, compared to national values.
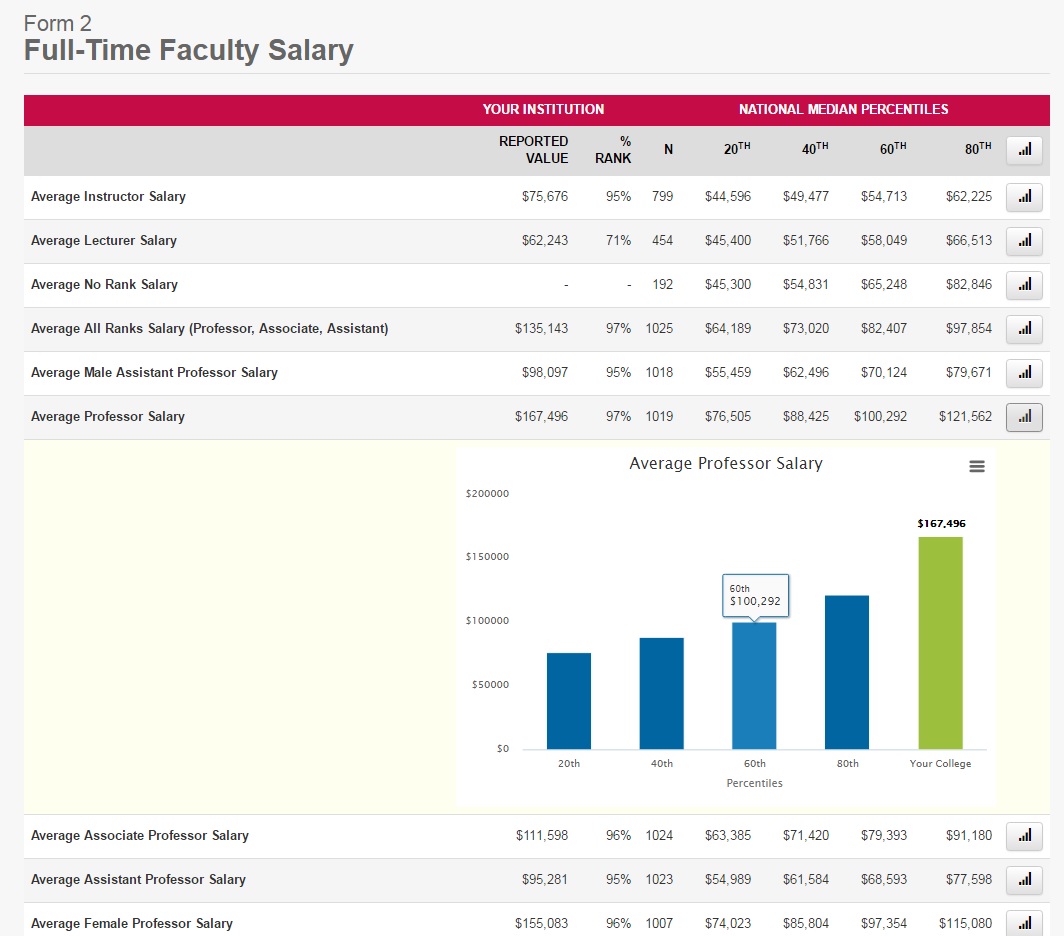
National median percentiles may be compared to the user institution. The percentile rank represents the user's reported institutional value relative to the national median. Bar charts for each statistic may be viewed using the bar chart icon on the far right and values may be downloaded for export.